


O S&P 500 (SNPINDEX: ^GSPC) It is widely regarded as the best barometer for the US stock market overall due to its scope and diversity. The index tracks 500 large U.S. companies spanning all 11 market sectors, covering about 80% of domestic stocks by market capitalization.
The S&P 500 has returned 43%, or 11% per year, since Joe Biden was inaugurated as the 46th US president on January 20, 2021. But with just a few months to go until the next presidential election, investors can be curious about the performance of the stock market. under other Democratic and Republican presidents.
The average stock market return under Democratic and Republican presidents
O S&P 500 was created in March 1957. Since its inception, the index has returned 12,510%, excluding dividend payments, which is equivalent to a compound annual growth rate (CAGR) of 7.4%. This does not mean that the S&P 500 has increased by 7.4% every year, but rather that it has averaged a return of 7.4% annually since 1957.
The chart below shows the CAGR of the S&P 500 during each presidency. It also shows the median CAGR under individual Democratic and Republican presidents. Dividend payments are excluded.
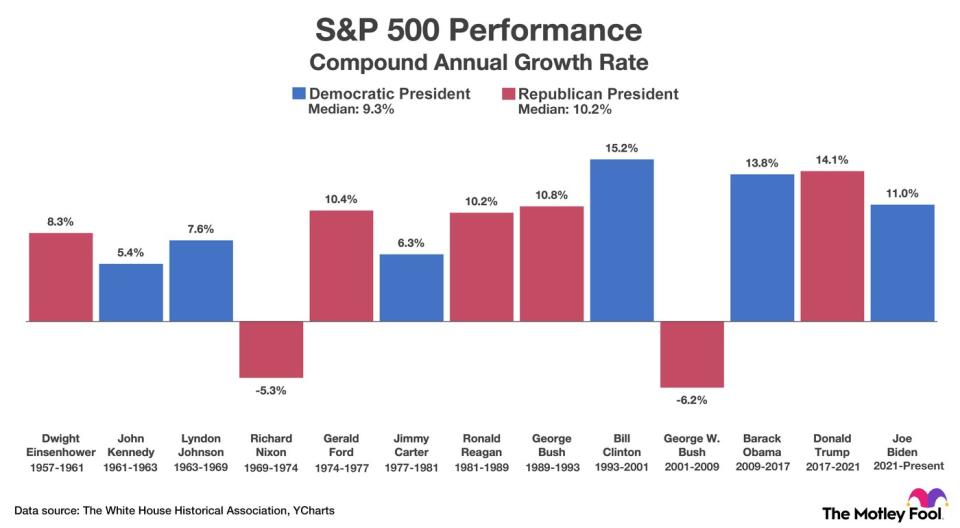
Since 1957, the S&P 500 has achieved a median CAGR of 9.3% under Democratic presidents and 10.2% under Republican presidents. Based on this information, it would be logical to conclude that the stock market has performed better when Republicans control the White House.
Not so fast! Statistics are easy to manipulate. Let’s consider the issue from another perspective. The chart below shows the return of the S&P 500 in each individual year since 1957. It also shows the average one-year return under Democratic and Republican presidents. Dividend payments are excluded.
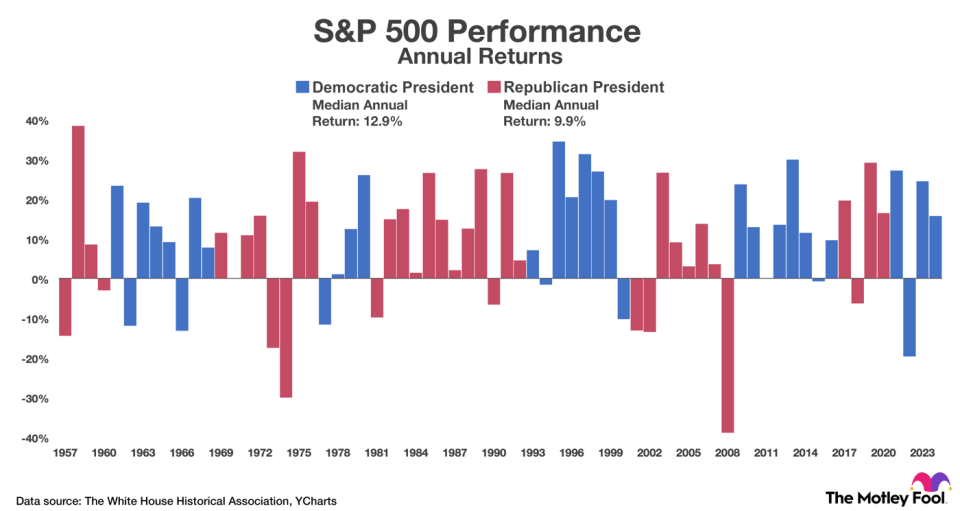
Since 1957, the S&P 500 has achieved an average one-year return of 12.9% under Democratic presidents and an average one-year return of 9.9% under Republican presidents. Based on this information, it would be logical to conclude that the stock market has performed better when Democrats control the White House.
So which political party is best for the stock market? It depends on how the data is analyzed. The S&P 500 has had good years and bad years under both Democrats and Republicans. However, the question itself is ultimately irrelevant for two reasons. First, macroeconomic fundamentals (not political parties) control the stock market. It is true that presidential policy and congressional legislation impact the economy, sometimes significantly, but no one person or political party has complete control.
Second, selectively buying and selling stocks based on the political party that controls the White House is a bad strategy that has historically led to underperformance. Search of Goldman Sachs shows that “investing in the S&P 500 only during Republican or Democratic presidencies would have resulted in major shortfalls compared to investing in the index, regardless of the political party in power.”
Historically, the stock market has made patient investors richer, regardless of politics
With the 2024 elections quickly approaching, both presidential candidates can claim to be better for the stock market. They can even back up their claims with data. But investors should ignore such comments. Statistics can be manipulated to suit different agendas and stock prices are governed by macroeconomic factors that are beyond the control of any political party.
To illustrate my point, consider the dot-com bubble, the Great Recession and the Covid-19 pandemic. All three events led to stock market crashes, none of which could have been prevented by the president in power at the time. Democrats cannot be praised for inflated tech sector valuations during the mid-1990s, nor can Republicans be blamed for holding office when years of lax credit standards culminated in the 2008 financial crisis.
Most importantly, history says that patient investors will be well rewarded, regardless of which political party controls the White House. The S&P 500 has returned 2,080% over the past three decades, including dividends, which equates to 10.8% annually. This period covers such a wide range of economic climates that investors can be reasonably confident of similar returns in the future.
This does not mean that the S&P 500 will return 10.8% every year, but rather that the index will return approximately 10.8% annually (plus or minus a percentage point) over the next few decades.
Should you invest $1,000 in the S&P 500 index right now?
Before buying stocks in the S&P 500 index, consider the following:
O Motley Fool Stock Advisor the team of analysts has just identified what they believe to be the 10 best stocks for investors to buy now… and the S&P 500 index was not one of them. The 10 stocks that made the cut could produce monster returns in the coming years.
Consider when Nvidia I made this list on April 15, 2005… if you invested $1,000 at the time of our recommendation, you would have $786,046!*
Stock advisor provides investors with an easy-to-follow plan for success, including guidance on building a portfolio, regular analyst updates, and two new stock picks each month. O Stock advisor service has more than quadrupled the return of the S&P 500 since 2002*.
*Stock Advisor returns July 2, 2024
Trevor Jennewine has no position in any of the stocks mentioned. The Motley Fool has positions in and recommends the Goldman Sachs Group. The motley fool has a disclosure policy.
Here’s the average stock market return under Democratic and Republican presidents (hint: this might surprise you) was originally published by The Motley Fool


